


In last month’s blog, I began explaining the Risk Management technique, which is part of the Architecture Development Method in the TOGAF Standard. I outlined the differences between Enterprise Risk Management and Risk Management, the latter of which is explained in this and the previous blog. I also elaborated on the various types of risks that exist, as well as the approach to risk classification and identification.
This blog post builds on that information and details how to perform an initial risk assessment, determine impact and frequency, and monitor and visualize risk.
Initial Risk Assessment
The initial risk assessment takes place during Phases E and F of the Architecture Development Method. In Phase E, risks are captured in a catalog. Phase F proactively addresses these risks by creating a Risk Management Plan. This plan covers the potential risks identified during migration planning with proposed mitigation strategies. When a risk is identified in the course of architecture work, the first thing to consider is whether it is an initial risk or a residual risk. The former indicates a new, previously unaddressed risk, while the latter concerns a previously encountered – and possibly (partially) mitigated – risk.
There are no hard and fast rules with respect to measuring impact (effect) and frequency (likelihood). The guidelines described in the TOGAF Standard are based upon existing Risk Management best practices1.
Determining Impact and Frequency
Risks are usually classified with respect to impact (effect) and frequency (likelihood) in accordance with scales used within the organization. In most organizations, it is common to assign a value between 1 and 5 to both impact and frequency. The sample criteria shown in Table 1 and Table 2 can be used to classify the impact and frequency of risks. Of course, these criteria can be adapted to the organization.
| Impact (effect) | Impact level | Description |
|---|---|---|
| Catastrophic | 5 | Critical financial loss that could lead to the organization’s bankruptcy. |
| Significant | 4 | Causes severe financial loss in more than one line of business, resulting in lost productivity and no return on (IT) investment. |
| Moderate | 3 | Results in a small financial loss to a line of business and a reduced return on (IT) investment. |
| Low | 2 | Infers a very minor impact on the ability of a line of business to provide services and/or products, not accompanied by any type of financial loss. |
| Negligible | 1 | Assumes minimal impact on business unit’s ability to deliver services and/or products. |
| Frequency (likelihood) | Frequency level | Description |
|---|---|---|
| Frequent | 5 | Likely to occur very often and/or continuously. |
| Probable | 4 | Occurs several times during a transformation cycle. |
| Occasional | 3 | Occurs sporadically. |
| Seldom | 2 | Possible, but unlikely to occur more than once in the course of a transformation cycle. |
| Unlikely | 1 | Not likely to occur in the course of a transformation cycle. |
Combining Impact and Frequency
The two factors (impact and frequency) can be combined to provide a score and classification of the actual risk. Table 3 shows the criteria for risk classification.
| Classification | Indication | Description |
|---|---|---|
| Critical risk | C | The transformation effort is likely to fail, with serious consequences. |
| High risk | H | Significant failure of parts of the transformation effort, resulting in failure to achieve certain goals. |
| Moderate risk | M | Noticeable failure of parts of the transformation effort, jeopardizing the success of certain goals. |
| Low risk | L | Certain goals will not be fully achieved. |
Something very important to mention here is that the risk being measured is a risk to the organization. It is not a risk to the architecture or the work around it. The risks that emerge from the initial risk assessment are risks that the organization faces if the architecture described at this point is implemented.
When the impact and frequency values are plotted against each other, it is possible to see which risk classification applies to each intersecting cell. This risk classification scheme forms the basis for the Risk Heat Map (see Figure 1).
| Frequency | |||||
|---|---|---|---|---|---|
| Impact | Frequent | Probable | Occasional | Seldom | Unlikely |
| Catastrophic | C | C | H | M | L |
| Significant | C | H | M | M | L |
| Moderate | H | M | M | L | L |
| Low | M | M | L | L | L |
| Negligible | L | L | L | L | L |
For the initial risk assessment to work, everyone in the organization must agree on the definitions of impact levels and frequency. Once this agreement is reached, the values can be used to visualize the risks encountered in a Risk Heat Map.
Risk Monitoring
Residual risks must gain approval through the governance framework, potentially extending to corporate governance for business acceptance. Once accepted, it’s crucial to meticulously monitor the execution of mitigating actions, ensuring the organization addresses residual rather than initial risks. The identified risks are maintained and updated during Phase G, where risk monitoring occurs. This phase can spotlight critical risks that remain unmitigated, possibly necessitating another full or partial Architecture Development Method cycle.
Lateron, during Phase H, risk monitoring is performed with respect to changes to the architecture. The Architecture Change Management phase identifies risks associated with new requirements, technologies, or business changes. It implements risk response mechanisms as part of change management.
Visualizing Risk
After conducting the initial risk assessment, it may be a good idea to visualize the various risks identified and compare them to the organization’s risk appetite or tolerance. Although the TOGAF Standard does not formally describe how risk can be applied in visualizations, there are a number of ways to approach this.
A Risk Heat Map (see Figure 1) is a visualization tool that helps organize, define, and quickly communicate key risks. It is an essential tool in any Risk Management toolbox. Such a heat map is often used to focus management’s attention on the most important threats and opportunities and to lay the groundwork for risk responses. The heat map is based on the risk classification schema (Table 4) that was detailed earlier.
Risk heat mapping is a powerful technique that adds risk visualization to the Risk Management technique already described in the TOGAF Standard. The Risk Heat Map shows risk frequency (likelihood) on the horizontal axis (X) and risk impact (effect) on the vertical axis (Y). Together, these axes can help analyze a risk and decide what actions to take to mitigate it.
Creating the Heat Map
The Risk Heat Map is a two-dimensional representation of data in which values are typically represented by colors (often red, green, and yellow). It allows the architect to effectively and visually communicate which risks are of most and least concern to the organization, depending on its risk appetite or tolerance. Typically, green represents low risk, yellow represents medium risk, and orange/red represents high/critical risk. This information can guide risk mitigation and minimization strategies. In the risk assessment process, visualizing risks using a heat map provides a concise, big-picture view of the entire risk landscape, opening the door for discussion as decisions are made about the likelihood and impact of risks within the organization.
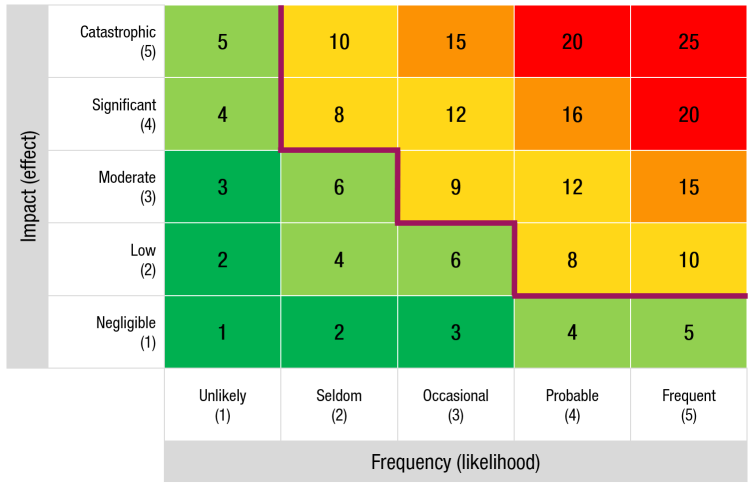
The use of a Risk Heat Map, as shown in Figure 1, is very effective in communicating which risks have the highest significance when considering their potential impact and the likelihood of that impact. Psycologically, people looking at the heat map are naturally drawn to the upper right quadrant (high impact and high likelihood), while items in other quadrants receive less attention.
Calculating Risk
To use a Risk Heat Map, it’s important for the organization to establish a common language for discussing risk. The paragraphs above outlined that terms such as impact or effect and frequency or likelihood need to be defined and used throughout the organization and in the design of the heat map. Consequently, this allows everyone to be on the same page when discussing risk. Using a Risk Heat Map also requires a common understanding of the organization’s risk appetite or tolerance. Risk tolerance refers to the highest level of risk that is still considered acceptable. In the Risk Heat Map shown in Figure 1, the risk tolerance is visualized by the maroon colored line. All the risk values below the line are considered to be acceptable and are therefore given a green color.
Risks are generally assigned a score for risk frequency (the likelihood that the risk will occur) and the impact or effect the risk will have on the organization. Unfortunately, there is no scientific approach to assigning these scores. Common sense is the best way to go here.
The formula for calculating risk is as follows.
Risk = Impact (effect) × Frequency (likelihood)
Filling In the Heat Map
Once each risk has been calculated, it can be plotted on the Risk Heat Map as shown in Figure 2.
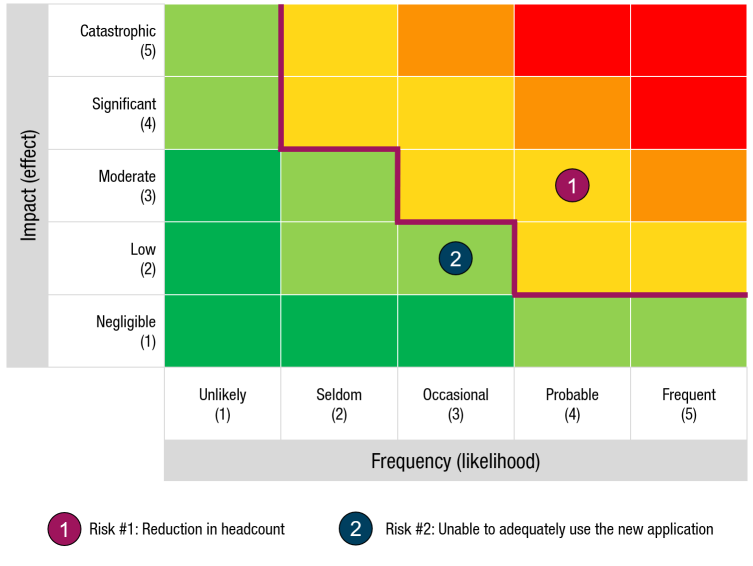
Figure 2 shows the Risk Heat Map described earlier with two risks. Each risk is represented by a number in a circle corresponding to the risk. For example, for the first risk (Risk #1), the impact is estimated to be moderate (3) and the likelihood of the risk occurring is estimated to be probable (4). Using the formula above, the risk score is 12, meaning medium risk classification. The second risk (Risk #2) has a low impact (2) and an frequency (likelihood) of occasional (3). Therefore, the risk score for the second risk is 6, classifying it as a low risk.
Scoring each risk in this way and plotting them in the Heat Map provides a good picture of which risks need the most attention. Implementation plans can be adjusted accordingly.
Conclusion
Risk Management is an essential part of every architecture effort. Or so it should be. Enterprise Architecture practitioners should be familiar with this technique and apply it to their daily work. Effective Risk Management can save an organization time and money while allowing it to focus on the most important aspects of its strategy.
Do you agree with my take on Risk Management? Let me know in the comments!
- The Open Group, The TOGAF® Standard, 10th Edition, Architecture Development Method. ’s-Hertogenbosch: Van Haren Publishing, 2022. ↩︎


Leave a Reply