Progress reports are used to monitor progress made regarding the implementation of Enterprise Architecture. First of all, it is important to determine what steps are required to achieve the creation of the desired architecture deliverables so that a percentage of progress can be assigned.
Applying the method
A short step-by-step plan can be used to achieve the desired understanding of progress. This plan should be applied to each individual topic for which progress is to be measured.
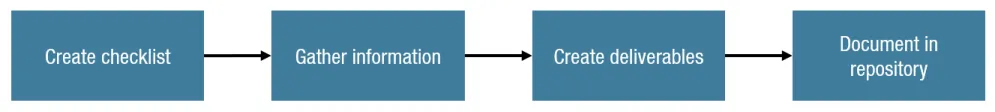
- Create checklist. First, create a checklist of activities that need to be planned and performed. Determine who needs to be approached to obtain the necessary information. Prepare questions and be sure to ask follow-up questions if some answers do not immediately lead to the desired information or level of detail. Try to keep the questions short and to the point, and limit them to a specific topic.
- Gather information. To gather the necessary information, appointments need to be made with people in the organization. If the initial appointments do not lead directly to the desired information, be sure to schedule follow-up appointments or select other people from the organization.
- Create deliverables. The information obtained can then be processed into catalogs, matrices, diagrams, and maps. This creates the architecture deliverables.
- Document in repository. Finally, it is important to capture the architecture deliverables in the architecture repository.
Once these four high-level steps have been successfully completed, that part is 100% realized. A fairly basic or more refined method can be used to determine what percentage of progress can be assigned to each step. The basic method assumes that a proportional percentage is assigned to all steps of the process to be performed. The more refined method involves assigning percentages based on, for example, the duration of each step.
Basic versus refined method
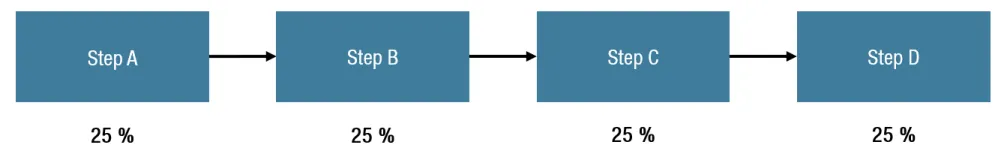
In the basic method, a four-step method yields a rate of 25% for each step. When the more refined method is used, for example, assigning a percentage based on the duration of each step, the distribution of percentages is often quite different. To illustrate, consider a process consisting of four steps, A, B, C, and D. Step A takes one hour to complete. Steps B and C each take two hours. Step D has a lead time of three hours. Using the more refined method of assigning percentages in proportion to the duration of the steps, the percentages for steps A through D would be 12.5, 25, 25, and 37.5%, respectively. Thus, assigning percentages based on the more refined method provides a more detailed picture of progress than using the basic concept of proportional percentages.
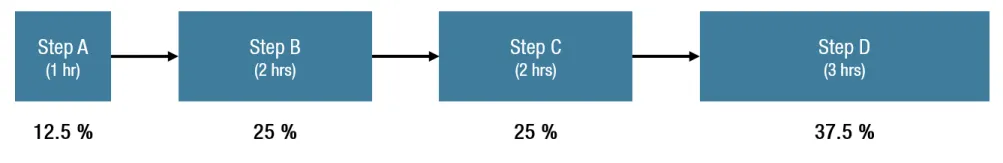
When the two methods are applied to a process in which three of the four steps are completed, the basic method yields a rate of 75%. The more refined method shows that completion of the first three steps accounts for 62.5%. The latter method, therefore, provides a more realistic picture of the progress being made.
Graphical representation
A common technique for charting the progress of individual deliverables is to use percentages and pie charts. The table below shows a fictitious example of (a part of) progress per deliverable from the first stage of the Enterprise Architecture Implementation Wheel.
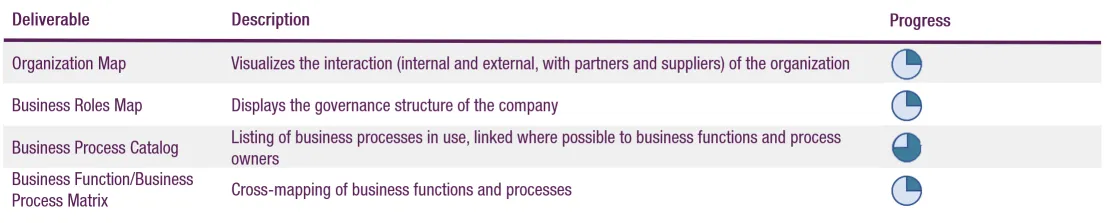
As can be seen in the table above, five values are used to express progress in percentages: 0, 25, 50, 75, and 100%. A small pie chart is included for each row in the table. The pie charts show the progress of each individual item. A similar form can also be chosen to show progress per stage. The question with this form of abstraction is whether it provides a sufficiently meaningful view of progress. Since each stage is made up of several subcomponents, a summary of progress may not provide the most insight.
Another way to provide insight into progress is to use spider charts. This type of chart uses percentage values to plot the current state against the desired end state, 100%. The figure below shows the percentage progress of the steps from the Implementation Wheel associated with the first stage.

Which form of visualization is chosen depends largely on personal preference. None of the forms described is more or less useful than the others.
Dashboards
In the examples provided on this page, a spider chart was used to visualize the progress of specific deliverables and stages from the Implementation Wheel. In addition to using this type of chart, it is also possible to display progress on specific topics in a dashboard.
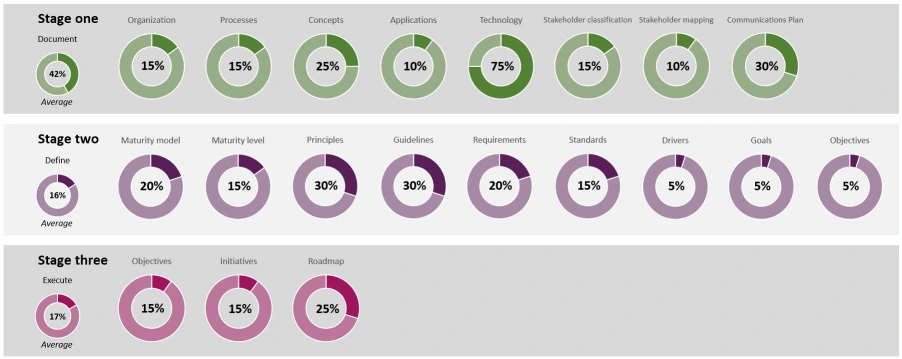
Dashboards are an excellent tool for displaying the overall progress of a particular topic. Especially at management level, dashboards like the one shown here are in demand. A dashboard omits most substantive information and simply shows the progress of an issue or program using easy-to-read and interpret graphs (such as pie charts) or gauges.
A graph can be created based on percentages that indicate how much of a particular topic has been accomplished (for example, using doughnut charts, as shown in the dashboard figure). When progress data is included in a dashboard, it provides a good visual overview; a kind of one-page progress view. It is important to note that a dashboard is only as good and useful as the accuracy with which the progress of the topics it displays is determined. A dashboard is nothing more than a way to visualize what has been measured through a thorough process.
More information
For additional information about creating Progress reports, please refer to Chapter 8, Sections 8.5.1.1 through 8.5.1.3, of my book Getting Started with Enterprise Architecture.