Many of the architecture deliverables and artifacts stored and categorized in the Architecture Repository consist of catalogs, diagrams, maps, and matrices.
The distinction between deliverables, artifacts, and building blocks becomes clear once we define these terms.
- Architecture deliverables are products created in the course of performing architecture work. They support the conversations that take place around architecture issues and provide insight into what certain situations or scenarios look like. They consist of one or more architecture artifacts.
- Architecture artifacts are standardized architecture products for capturing and visualizing information related to the architecture work being performed. They consist of one or more building blocks.
- Building blocks are the backbone of the architecture and serve as essential, reusable components in architectural solutions. They form a modular foundation, and are designed to be generic and adaptable. Building blocks are documented using catalogs, diagrams, maps, and matrices and stored and categorized in the Architecture Repository
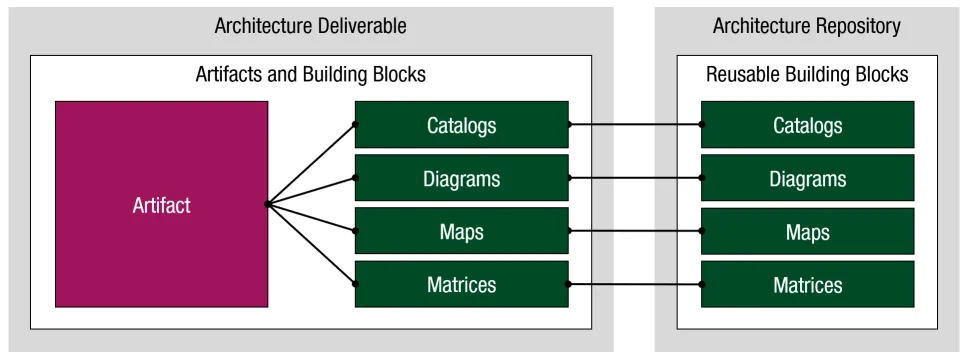
The relationship of catalogs, diagrams, maps, and matrices to building blocks and architecture artifacts is shown in the figure below. The image shows that an architecture deliverable consists of one or more artifacts and that each artifact consists of one or more building blocks. A building block typically consists of one or more architecture entities.
Catalogs
Catalogs are lists of building blocks of a specific entity, type, or related types that are used for governance or reference purposes. A catalog addresses a specific entity (e.g., processes, applications, technology components) and supplements the information about the concept with additional data. In a catalog, entities are not linked to other entities. An example of a catalog is shown in the following table.
| Entity name | Value A | Value B |
|---|---|---|
| Entity A | … | … |
| Entity B | … | … |
| Entity C | … | … |
A commonly used catalog is the Stakeholder Catalog. This catalog lists all stakeholders relevant to the architecture effort, along with their key concerns, classification, and interest (in the form of information provided).
Diagrams and maps
Diagrams and maps are representations of architectural content in either graphical format (diagrams) or textual format (maps). These artifacts can also be used as a technique for graphically populating architectural content or for verifying the completeness of collected information (think, for example, of an organizational diagram in which locations and actors are added). A diagram or map visualizes information captured in a catalog or matrix.
| Entity A (Actor) | Entity B (Process) | Entity C (Business Service) |
|---|---|---|
| Actor A | Process A | Business Service A |
| Actor B | Process B | Business Service B |
| Actor C | Process C | Business Service C |
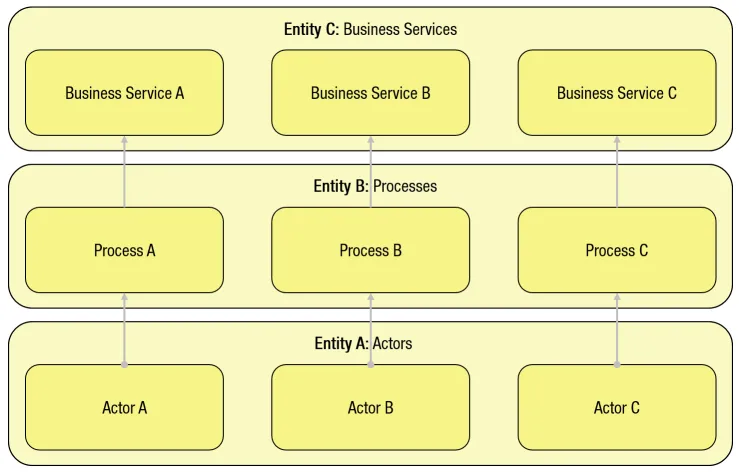
The figure above (the example of a diagram) shows the same information as the table that contains the example of a map, but in a graphical form. The figure is therefore called a diagram, as opposed to the table, which is called a map.
One of the more known and often used diagrams is called the Process Flow Diagram. Such a diagram visualizes the steps necessary to perform a certain process in a graphical manner.
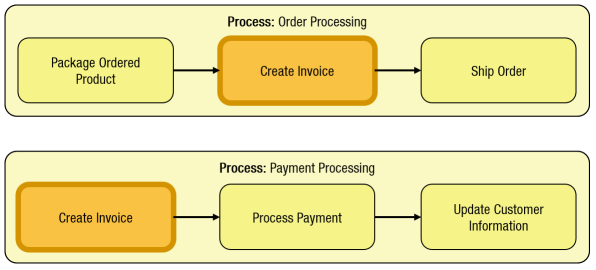
A well-known example of a map is Organization Map. This artifact shows the relationships between the primary entities that make up the organization, its partners, and stakeholders.
Matrices
A matrix is a grid that represents the relationships between two or more model entities. The relationship between the entities – typically spread across two or more catalogs – is brought together in a matrix. The method of bringing entities together is called cross-mapping.
| Entity A | Entity B Value A | Entity B Value B | Entity B Value C |
|---|---|---|---|
| Entity A Value A | X | ||
| Entity A Value B | X | ||
| Entity A Value C | X |
The table above shows two entities mapped together to create a cross-mapping. In the example, Entity A is cross-mapped to Entity B, to demonstrate their relationship. Entity A Value A has a direct relation with Entity B Value A, but not with Entity B Values B and C.
Knowing what to visualize – and what not to – is important for communicating with organizational stakeholders. As a general rule, less is more. Therefore, it is recommended to limit the amount of information used and displayed in a catalog, diagram, map, or matrix. It is better to create more views than to overload existing ones with information at the expense of the readability (and thus usability) of the architecture artifacts.
More information
For additional information about catalogs, diagrams, maps, and matrices, please refer to Chapter 6, Section 6.3, of my book Getting Started with Enterprise Architecture, or Chapter 7, Section 7.4, of Mastering the TOGAF® Standard.